Figure 7.
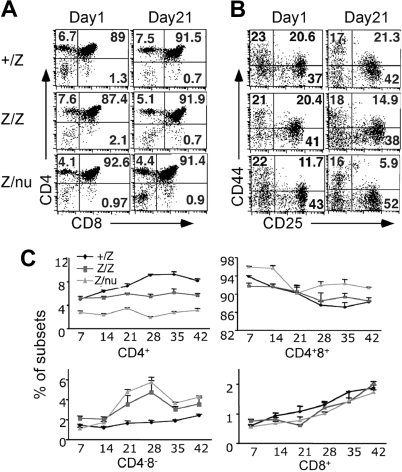
T-cell development was affected in mutant thymi. (A) Thymocytes from +/lacZ, lacZ/lacZ, and lacZ/nu thymi at newborn stage and 3 weeks were analyzed for CD4 and CD8 expression with flow cytometry. Numbers of DN, CD4+ SP, CD8+ SP, and DP cells are indicated as percent. (B) Gated CD4−CD8− DN populations at newborn and 3 weeks were analyzed for CD44 and CD25 expression. Numbers of DN1 (CD44+CD25−), DN2 (CD44+CD25hi), DN3 (CD44−CD25hi/lo), and DN4 (CD44−CD25−) cells are indicated as percent. (C) Summary of each subpopulation at multiple time points. Each time point represents at least 3 subjects.

