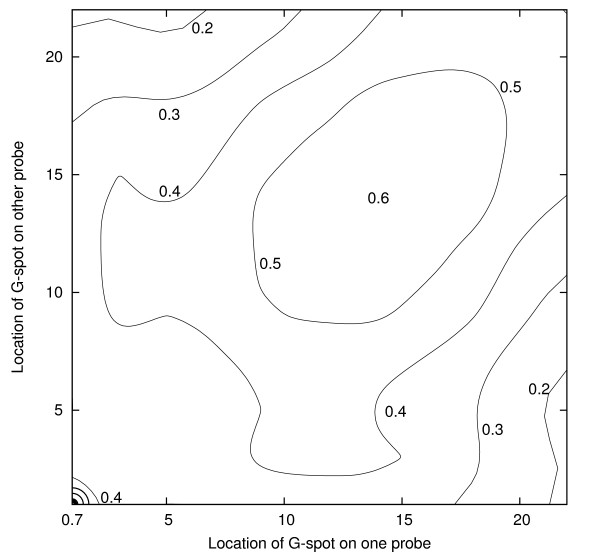
Figure 5.
Contour diagram showing how the average value of the correlation coefficient varies with the location of G-spot for pairs of probes (each with a single sequence of four guanines). The values in Table 1 correspond to the main diagonal and those in Table 3 to two edges. The maximum is at the bottom left.

