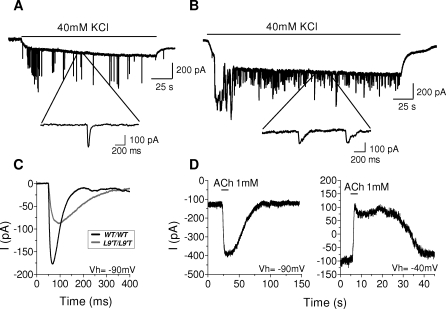
Figure 5. Prolonged Synaptic Currents in OHCs.
(A) Representative traces of IPSCs evoked by 40 mM K+ in OHCs of P10–P11 Chrna9wt/wt mice at a V hold of −90 mV. The insets show synaptic currents on an expanded time scale.
(B) Same as in (A) but for Chrna9L9′T/L9′T mice.
(C) Superimposed representative traces of nAChR+SK2 synaptic currents from a Chrna9wt/wt; (39 events) and a Chrna9L9′T/L9′T (77 events) mice. The representative traces shown are the average of the different events in one cell (number of cells per experiment indicated in Table 2). Vh, V hold; WT, wild type.
(D) Representative responses of OHCs to 1 mM ACh at a Vhold of −90 mV and −40 mV.

