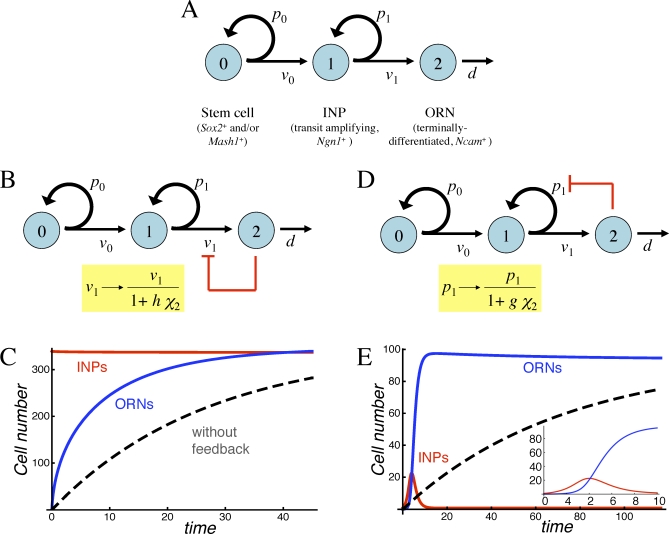
Figure 3. Strategies for Feedback Regulation of Transit-Amplifying Cells.
(A) The neuronal lineage of the OE, in which terminally differentiated ORNs are produced by committed transit-amplifying cells (INPs).
(B) Negative feedback regulation of the INP cell cycle length (shown diagrammatically in red) can be modeled by making v 1 a function of ORN numbers (χ 2).
(C) Simulated return to steady state of the system in (B) after removal of all ORNs. The parameters chosen provide the greatest improvement in regeneration speed (over what would occur in the absence of feedback; dashed line), consistent with progenitor cells comprising no more than 50% of the tissue mass (note that INP numbers [red curve] are virtually the same as those of ORNs [blue curve] at steady state). Cell numbers are expressed relative to the starting number of stem cells.
(D) Negative feedback regulation of the INP replication probability (shown diagrammatically in red) can be modeled by making p 1 a function of ORN levels (χ 2).
(E) Simulated return to steady state of the system in (D) after removal of ORNs. An inset shows the response at early times in greater detail. Note that progenitor load is now quite low, and regeneration is characterized by a burst of INP proliferation (red curve), followed by a wave of ORN production (blue curve).
In (C and E), time is expressed in units of ln2/v 1. Parameter values for (C) are p 1 = 0.495, d/v 1 = 0.0372, v 0/v 1 = 0.128, and h = 0.0734, and for (E) are p 1 = 0.942, d/v 1 = 0.0138, v 0/v 1 = 0.506, and g = 0.0449.

