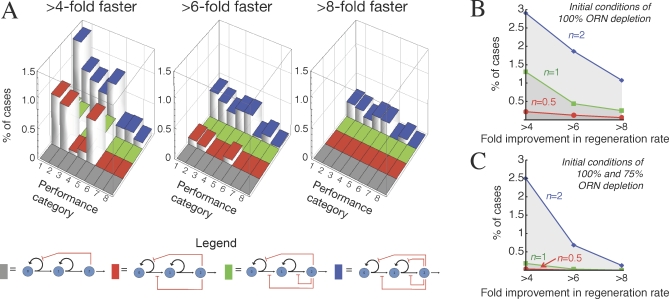
Figure 6. Effects of Feedback Configuration on Regeneration from Diverse Perturbations.
(A) Four different feedback architectures (shown diagrammatically beneath the word “Legend”) were modeled and investigated for their ability to support rapid regeneration from multiple starting conditions. For each model, 20,000 random parameter sets were explored (see Protocols S1–S3, section 8) using simulations that started from initial conditions corresponding to four different perturbations of the steady state. For all 640,000 solutions, the fold improvement in ORN regeneration speed was calculated as in Figure 5. The bar graphs depict the fractions of random parameter sets for each model that produced at least a given amount of improvement in regeneration speed for one or more sets of initial conditions. The four different feedback architectures are designated by different colored bars (see diagrams under “Legend”): feedback on p 0 (grey); p 0 and v 0 (red); p 0, v 0, and v 1 (green); and p 0, v 0, p 1, and v 1 (blue). The heights of bars give the fraction of parameter sets that produced at least the indicated amount—4-fold (left graph), 6-fold (middle graph), or 8-fold (right graph)—of improvement in regeneration speed. The “Performance categories” refer to different combinations of initial conditions: Cases included in performance category 1 are those that met the desired level of improvement in the speed of regeneration following a complete loss of terminal-stage cells. In category 2, the perturbation was a complete loss of both terminal-stage and transit-amplifying cells. In category 3, it was a 75% loss of terminal-stage cells. In category 4, the perturbation was a complete loss of terminal-stage and transit-amplifying cells and a 50% loss of stem cells. Category 5 cases are those parameter sets that met the criteria for initial conditions of both categories 1 and 2. Category 6 refers to those that did so for both categories 1 and 3. Category 7 refers to those that did so for both categories 1 and 4. Category 8 refers to cases in which the parameter sets met the indicated criterion for all four initial conditions. The data show that rapid regeneration from a variety of initial conditions is facilitated by feedback on the p-parameters of at least two progenitor cell stages.
(B and C). For the system with feedback on p 0, v 0, p 1, and v 1 (i.e., the system depicted with blue bars in [A]), the graphs show the percentages of random parameter sets that meet the regeneration-rate criteria on the abscissa (4-fold, 6-fold, or 8-fold improvement in regeneration speed), as a function of the Hill coefficient, n, used in the expressions for the feedback functions. The results in (B) were obtained by only considering simulations that started from a 100% loss of terminal-stage cells. Cases presented in (C) are those that also met the same regeneration-rate criteria for simulations starting from a 75% loss of terminal-stage cells. The results show that larger n substantially increases the fraction of cases with rapid regeneration. This effect is especially prominent when the performance criteria call for fast regeneration from more than one set of initial conditions (C).

