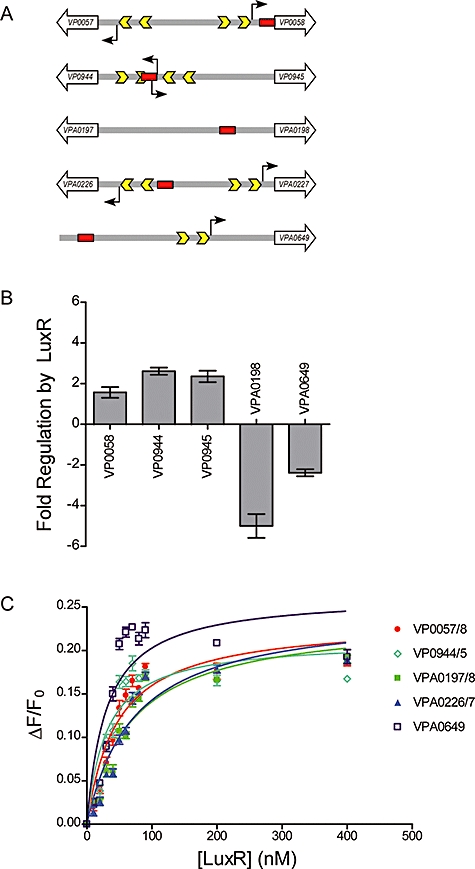
Fig. 7.

Predicted genomic targets of LuxR.
A. Five promoter regions containing predicted LuxR binding sites (red boxes) identified in the V. harveyi genome are shown. Transcriptional start sites were identified, where possible, with 5′RACE (black arrows), and σ70 −35 and −10 promoter sequences are shown as yellow arrows. No transcriptional start site could be identified for VPA0197 or VPA0198.
B. gfp expression from predicted promoter fusions (shown in A) in E. coli. Fold regulation by LuxR is represented as positive values for activated genes and negative values for repressed genes. Genes that showed no expression are not included in the panel. Measurements were made in triplicate, and fold repression calculated as the ratio LuxR-/LuxR+ for repressed promoters and LuxR+/LuxR- for activated promoters. Error bars represent the standard deviation of the ratio, calculated via the formula for propagation of error.
C. In vitro LuxR binding to the predicted binding sites from A. Binding curves are shown for VP0057/8 (red), VP0944/5 (light blue), VPA0197/8 (green), VPA0226/7 (dark blue) and VPA0649 (purple). The fractional change in anisotropy is plotted against the concentration of LuxR (nM). Error bars represent the standard deviation of three independent binding reactions.
