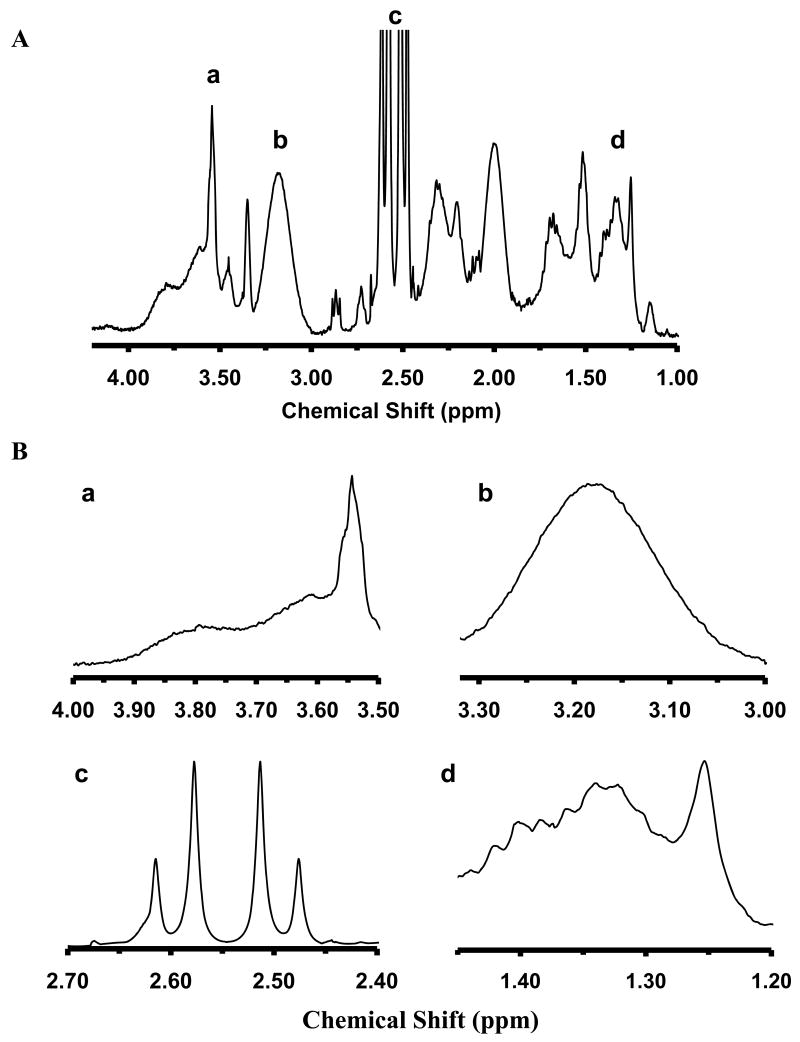
Figure 2.
NMR characterization of functional groups of AgMMUA nanoparticles:
(A) Representative NMR spectra of AgMMUA nanoparticles;
(B) Zoom-in of individual peaks of NMR spectra in (A): (a) δ = 3.55 ppm, integration = 2.00, (2H, -(CH2)-OH of MCH); (b) δ = 3.18 ppm, integration = 8.65, (2H, from PVP ring); (c) δ = 2.55 ppm, integration = 25.23, (–CH2- next to thiol from both MUA and MCH and 4H from citrate. (d) δ = 1.20-1.45 ppm, integration = 6.05, (12H from -(CH2)6-CH2COOH of MUA and 4H from –(CH2)2-CH2OH of MCH). Molar ratio of citrate: MCH: MUA: PVP = 28: 5: 1: 0.04

