
Fig. 2.
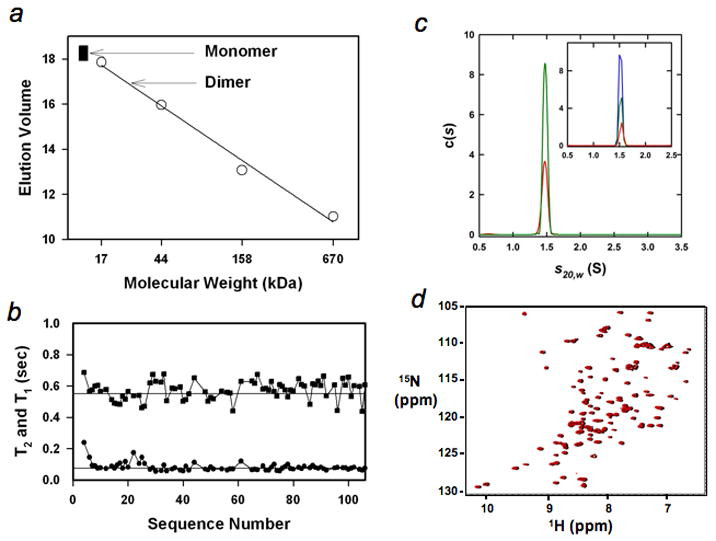
The intermediate mimic is a monomer. (a), Gel filtration (Sephadex G-75) of the intermediate mimic (filled squares, repeated three times at protein concentrations from ~10 μM to ~100 μM) and standards (circles), including horse myoglobin (17 kDa), chicken ovalbumin (44 kDa), bovine γ-globulin (158 kDa), and bovine thyroglobulin (670 kDa). The arrows indicate the anticipated monomeric and dimeric positions. (b), Longitudinal and transverse relaxation times, T1 (square) and T2 (circle). The straight lines illustrate the values of 0.55 s and 75 ms respectively. (c), c(s) distributions based on sedimentation velocity data collected at 60 krpm, 300 nm and 20.0°C are shown for loading concentrations of 100 μM (red) and 200 μM (green). The inset shows the c(s) distributions for sedimentation velocity data collected at 60 krpm, 285 nm, 20.0°C and loading concentrations of 7.1 μM (red), 14.3 μM (green) and 28.6 μM (blue). (d), Overlay of the 1H-15N HSQC spectra of the intermediate mimic at 1 mM (black) and 200 μM (red). The peaks in black were slightly shifted toward right to help to observe them.