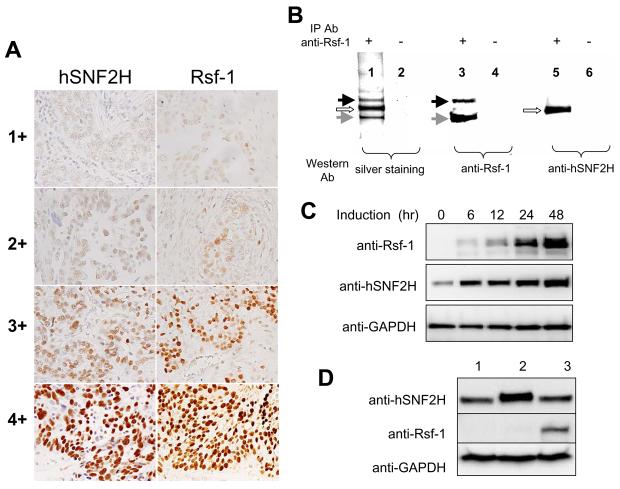
Fig. 1.
Co-upregulation of Rsf-1 and hSNF2H expression in ovarian carcinoma cells. A: Immunohistochemistry using anti-Rsf-1 and anti-hSNF2H antibodies on ovarian serous carcinoma tissues. Representative tissue sections with different immunointensity (from 1+ to 4+) of Rsf-1 and hSNF2H are illustrated. For each intensity group, both sections were obtained from similar areas of the same specimen. B: Co-immunoprecipitation was performed to assess if Rsf-1 protein form a complex with hSNF2H protein in OVCAR3 cells. Protein lysate was pulled-down by an anti-Rsf-1 antibody, separated by gel electrophoresis and visualized by silver staining (lane 1). Western blotting was performed to demonstrate the major proteins in the pulled down fraction were Rsf-1 with molecular weight of ∼215 kD (black arrow) and a degradation product of ∼130 kD (gray arrow, lanes 3) and hSNF2H protein with a molecular weight of ∼146 kD (open arrow, lane 5). Protein G alone was used as the control in immunoprecipitation in lanes 2, 4, and 6. C: SKOV3 ovarian cancer line which expresses an undetectable level of endogenous Rsf-1 was engineered to express Rsf-1 controlled by a Tet-off system. Rsf-1 induction increases the hSNF2H protein level in a time-dependent fashion based on Western blotting analysis. D: Western blot analysis showed no increase in Rsf-1 protein level in HEK293 cells which was previously engineered to overexpress hSNF2H (lane 2) as compared to the parental cell control (lane 1). OVCAR3 cells served as the positive control for this assay (lane 3). GAPDH was used as the loading control.

