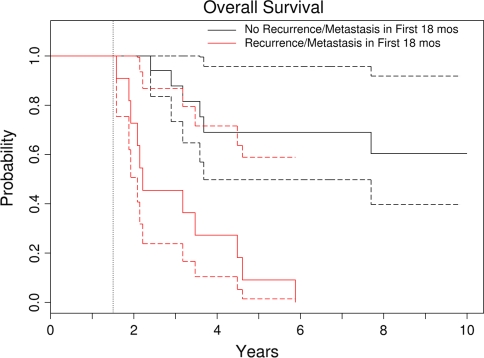
Fig. 2.
This Kaplan–Meier survival curve shows overall survival using an 18-month landmark. Patients were grouped into those who had local recurrence or metastasis within the first 18 months and those who were free of recurrence or metastasis at 18 months. This is a graphic representation of the time-dependent effect of recurrence and metastasis on survival. The dotted curves represent the 95% confidence intervals. Patients who had metastasis develop within the first 18 months had worse survival than those who did not.

