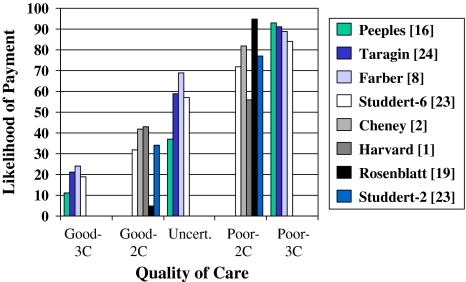
Fig. 4.
This graph shows the correlation between likelihood of settlement and quality of care when results of the reliable 2-category and 3-category studies are combined. The two middle categories of the 6-category Studdert et al. [23] data were combined.

