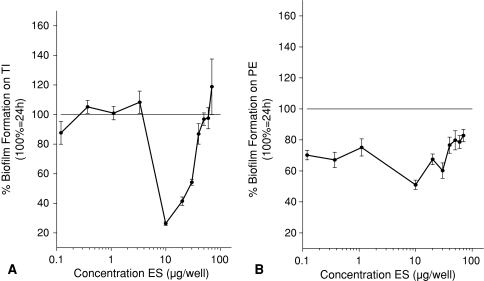
Fig. 4A–B.
These figures show a comparison between the mean BF with ES that were directly added to the bacteria and the mean control 24-hour BF without ES (defined as 100%) and answer partially the first research question, whether ES prevent BF. All values lower than 100% show prevention of BF. (A) Biofilm was prevented (all p values < 0.001) on TI by ES in a concentration range from 10 to 30 μg ES per well. (B) Biofilm was prevented (all p values ≤ 0.013) on PE by ES in a concentration range from 0.12 to 30 μg ES per well. BF = biofilm formation; ES = excretions and secretions; TI = titanium; PE = polyethylene.

