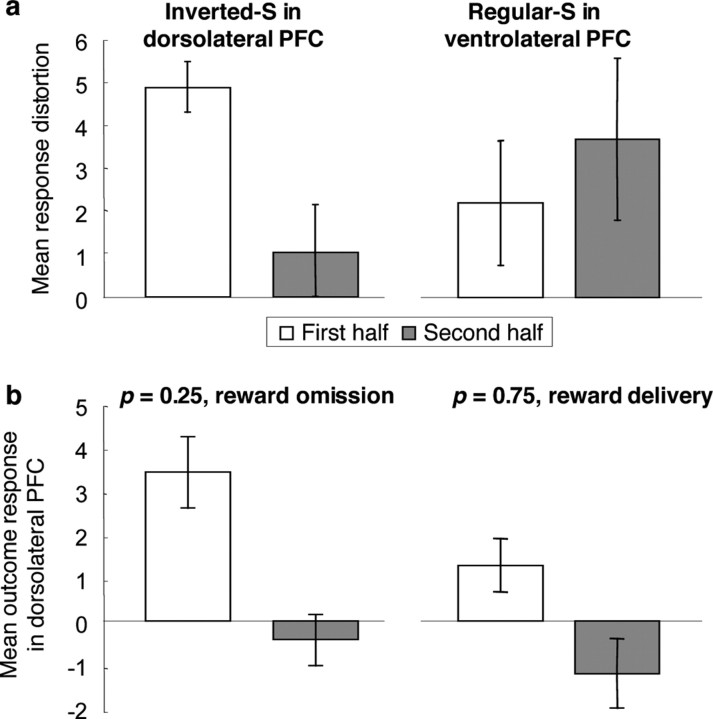
Figure 4.
Change of neuronal probability distortions as a function of experience. a, Left, Decrease of fit of activation to regressor testing for inverted S-shaped function in first and second half of the experiment (P < 0.05, small volume correction in cluster identified for Fig. 2). Peak of differential activation was at −32/14/36, in immediate vicinity to peak voxel shown in Figure 2 a. a, Right, No change of fit of activation to regressor testing for regular S-shaped probability-weighting function with experience at peak voxel shown in Figure 3 a. For this figure, inverted S-shaped and S-shaped activation were defined as described in Figures 2 and 3, respectively. b, Left, Differential activation between first and second half of experiment induced by omission of reward at p = 0.25 (P < 0.05, small volume correction). b, Right, Differential activation between first and second half of experiment induced by delivery of reward at p = 0.75 (P < 0.05, small volume correction). For b, peak of differential activation was at −32/16/34, same voxel as shown in Figure 2 a. There were no significant differences between the first and second half of the experiment in dorsolateral prefrontal cortex for delivery of reward at p = 0.25 and omission of reward at p = 0.75, and for all comparisons in ventrolateral prefrontal cortex (peak voxel of Fig. 3 a; all P > 0.1). In this figure, response plots correspond to average contrast estimates, error bars to 90% confidence intervals.

