. 2008 Dec 3;93(2):176–181. doi: 10.1136/bjo.2008.137356

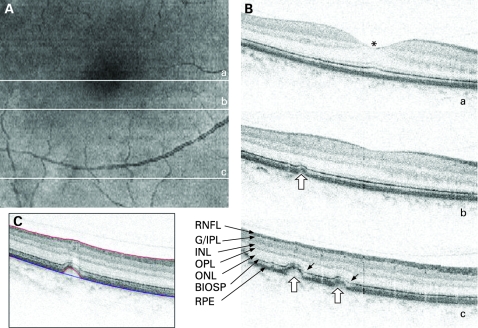
Figure 2. Spectral domain optical coherence tomography (SDOCT) images of the right eye of a patient with dry age-related macular degeneration (patient A). (A) Integrated reflectance image. Letters a, b and c indicate the position of the selected frames. (B) Upper frame: centre of the fovea (a, asterisk, top right); middle frame: from inferior to the fovea (b, middle right). Last frame (c, bottom right): several drusen temporal to macula (hollow arrows). Note the reduced reflectance of the boundary between the inner and outer segments of the photoreceptors (IS/OS) around drusen (short arrows). (C) Baseline (blue line) and drusen boundary (lower red line) as determined by our algorithm. The single frames are expanded vertically by 2.67 for better visualisation of the retinal layers. The light source was a Ti:sapphire laser with axial resolution of 3 μm. G/IPL, ganglion cell/inner plexiform layer; INL, inner nuclear layer; IS/OS, boundary between the inner and outer segments of the photoreceptors; ONL, outer nuclear layer; OPL, outer plexiform layer; RNFL, retinal nerve fibre layer; RPE, retinal pigment epithelium.

Figure 2