. 2008 Dec 3;93(2):176–181. doi: 10.1136/bjo.2008.137356

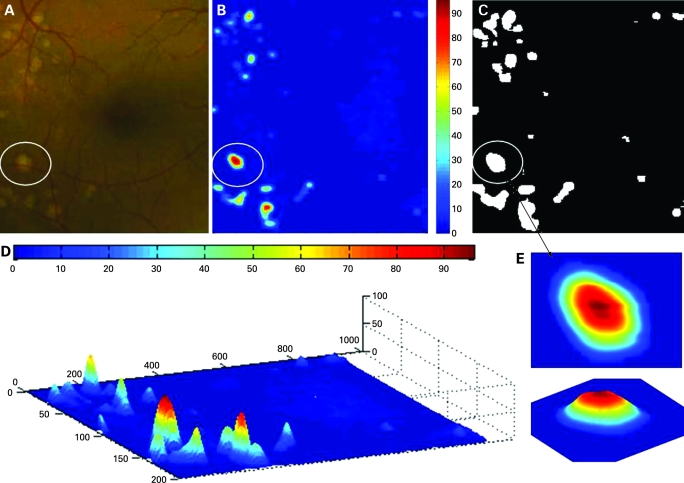
Figure 3. Results of the automated drusen analysis from fig 2. (A) Retinal area of drusen analysis. (B) Corresponding retina with a false-colour scale after analysis. (C) Retina area with drusen, elevated above the baseline more than 8 µm (5 pixels of 1.6 µm), shown as white. The proportion of retina with drusen was calculated as 5.85% of the total scan surface. (D) Analysed retina displayed three-dimensionally. The height was elongated in this figure by five times. The colour bars are scaled as actual size in microns. (E) One of the drusen (circled, from top figures) shown without height elongation. The calculated area of this druse is 1.46×105 μm2 or 0.146 mm2, and the volume is 9.31×106 μm3 or 9.31×10⁻³ mm3. The total area of scan was 4.97 mm×5.18 mm×1.24 mm.

Figure 3