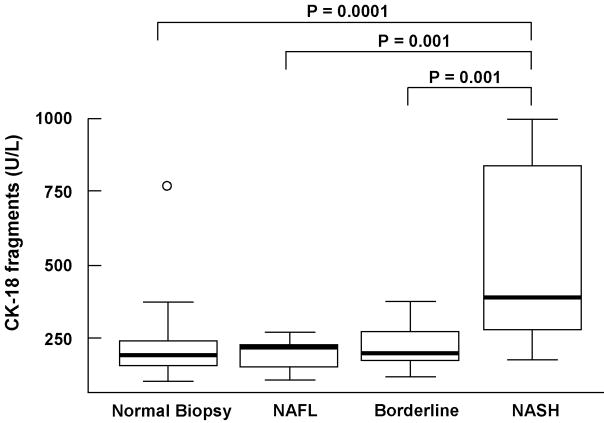
Figure 1. CK-18 fragments in morbid obese patients undergoing bariatric surgery.
Vertical axis is plasma CK-18 levels in U/L and horizontal axis patient groups. The box represents the interquartile range (the 25th and 75th percentiles) from the median (the horizontal line), the bars the 95% confidence interval. CK-18 fragment levels were significantly increased in patients with NASH as compared to patients with normal liver biopsy, NAFL and borderline diagnosis.

