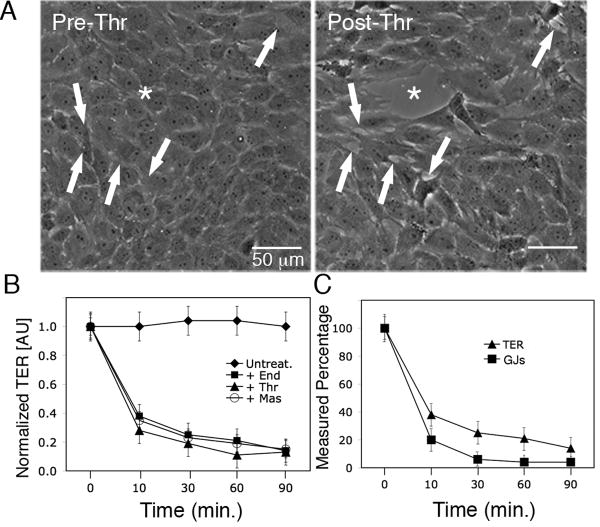
Figure 2.
Vascular endothelial cell permeability increases in response to inflammatory mediators. (A) Phase contrast images of a single field of view of a PAEC monolayer pre- and post-thrombin (10U/mL) treatment. Note the development of smaller separations at arrows and a larger “gap” (asterisk) within 30 minutes, as cells physically separated from one another. (B) TER of PAECs was determined over time before and after addition of endothelin-1 (50nM), thrombin (10U/mL) or mastoparan (240nM) Resistance measurements of untreated cells were used to establish a baseline for normalization, and (C) average number of GJs at the PM (n=15 cells) and average TER measurements (n=9) in treated cells were compared to untreated cells and expressed as a percentage. Values shown are mean ± SEM.

