
Figure 3.
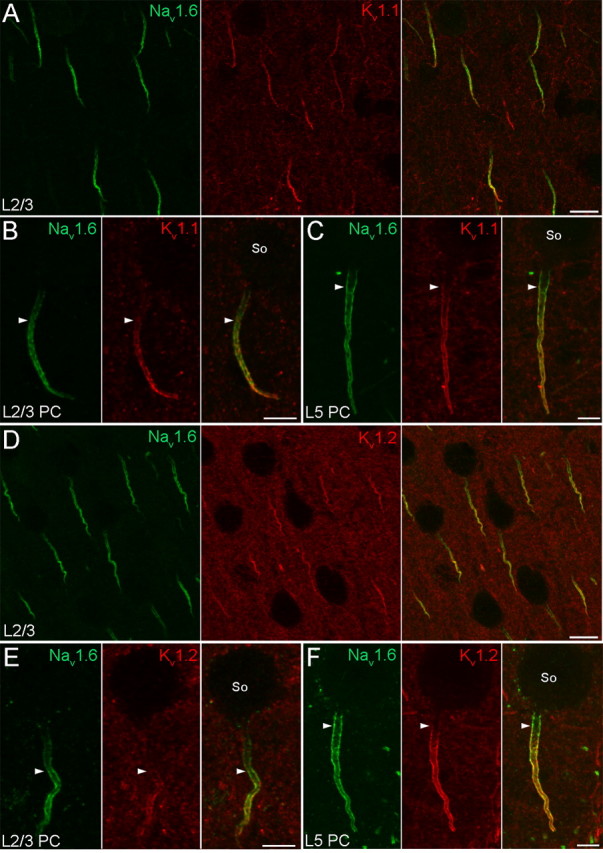
Distribution of the Nav1.6, Kv1.1, and Kv1.2 subunits in the AIS of neocortical PCs. A, B, Double immunofluorescent reactions demonstrate the colocalization of Nav1.6 and Kv1.1 immunolabeling in layer 2/3 PC AISs. B, High-magnification images of a layer 2/3 PC reveal a gradual increase of Nav1.6 and Kv1.1 labeling toward the distal part of the AIS. Immunolabeling for the Kv1.1 subunit begins more distally (arrowheads) compared with that of the Nav1.6 subunit. C, High-magnification images of a layer 5 PC demonstrate a more even Nav1.6 subunit immunolabeling; it appears proximally, close to the axon hillock, whereas the Kv1.1 immunolabeling emerges more distally (arrowheads). D, A double immunofluorescent reaction shows the colocalization of Nav1.6 and Kv1.2 subunits in layer 2/3 PC AISs. E, High-magnification images of a layer 2/3 PC reveal a gradual increase of Nav1.6 and Kv1.2 labeling along the AIS. Immunolabeling for the Kv1.2 subunit begins more distally (arrowheads) compared with that of the Nav1.6 subunit. F, High-magnification images of a layer 5 PC demonstrate a rather uniform distribution of Nav1.6 subunit immunolabeling, whereas the Kv1.2 immunolabeling appears a bit more distally (arrowheads). So, Soma. Scale bars: A, D, 10 μm; B, C, E, F, 5 μm.