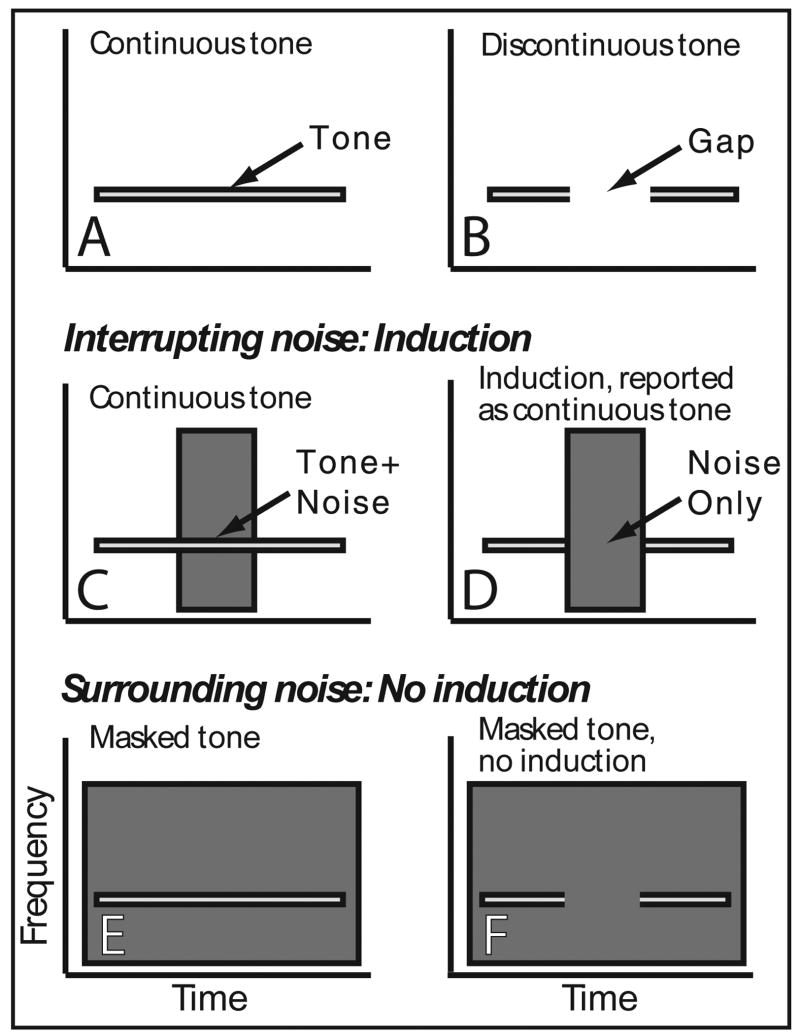
Figure 1.
Schematized spectrograms demonstrating stimuli and their relationship to illusory induction and masking. Spectrograms of (A) continuous and (B) discontinuous tones, and interrupting noise centered in (C) continuous and (D) discontinuous tones. High intensity interrupting noise causes perceptual restoration (induction) of the deleted tone segment with the tone being reported as continuous even when it is not. Here both a continuous foreground and noise are perceived. Spectrograms of surrounding noise temporally overlapping entire (E) continuous and (F) discontinuous tones. High intensity surrounding noise masks the tone and only noise is heard.

