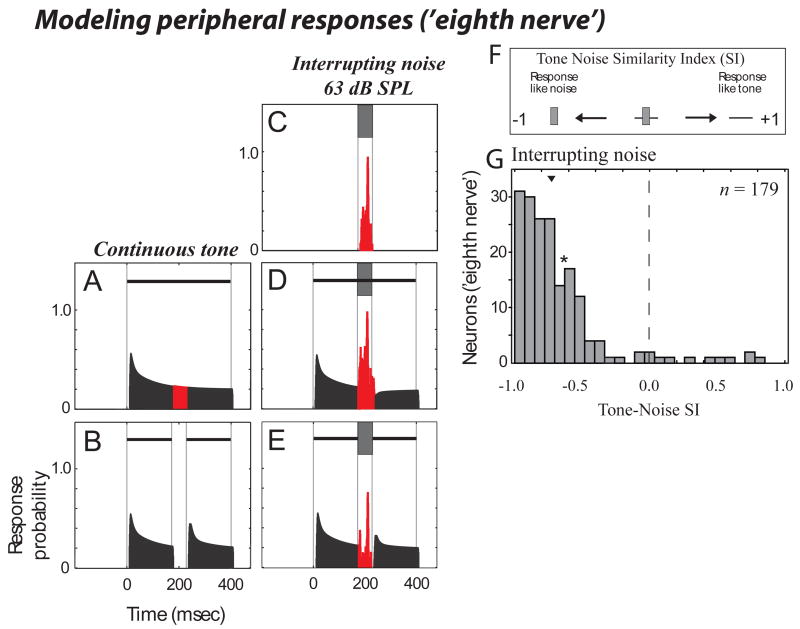
Figure 8.
Simulated peripheral responses support only the physical properties of the stimuli. Shown is a modeled 'eighth nerve neuron' response to the stimuli used to assess induction in our A1 neurons. Here the tonal stimuli are 2 kHz tones centered at the ‘BF’ of the simulated neuron. For display purposes the spontaneous 'firing rate' is not shown. (A-E) is in the same stimulus/response format as for Fig. 3a-e. (F) is as in Figure 7a, which schematizes the range of TNSI response values that can be obtained including how to interpret positive and negative values (positive values show that the response to the stimulus known to elicit induction are like those to a continuous tone, negative values that the response to this stimulus is as if only noise were presented). (G) shows the modeled distribution of peripheral responses. Arrowhead show the median, and the asterisk (*) shows the TNSI value for the example shown in (A-E).

