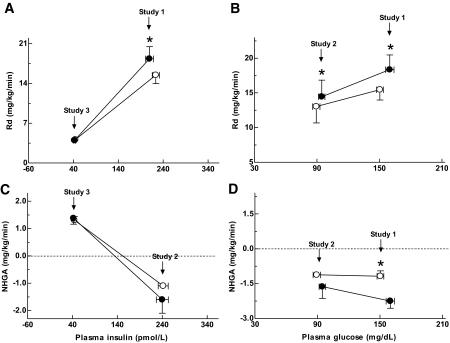
FIG. 5.
The clamp steady-state data of Rd and NHGA expressed against their respective plasma insulin (A and C) or glucose (B and D) levels. ○, saline; •, exenatide. Study 1, postprandial hyperinsulinemia plus hyperglycemia; study 2, hyperinsulinemia plus systemic euglycemia; study 3, hyperglycemia plus basal insulin levels. *P < 0.05, significantly different from saline.

