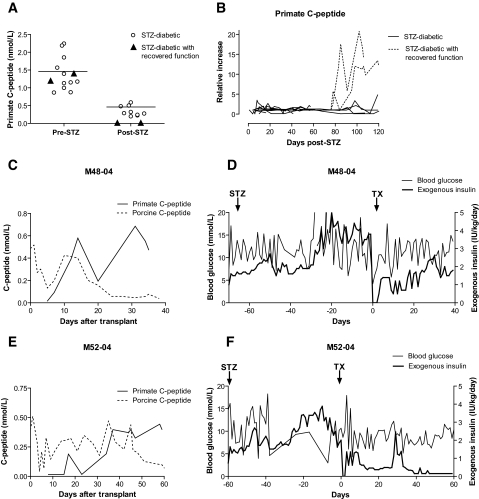
FIG. 1.
A: Endogenous C-peptide levels before and after STZ treatment. Closed triangles indicate the values of C-peptide in the two monkeys that recovered autologous insulin production. B: Relative increase of endogenous C-peptide over basal post-STZ values. Solid lines indicate STZ-diabetic monkeys that were not transplanted (n = 3) as well as STZ-diabetic recipients that experienced early graft loss (n = 6). Dotted lines represent the monkeys with recovered β-cell function (n = 2). C–F: Metabolic profile of the monkeys with recovered endogenous C-peptide (M4804 and M5204). C and E: Graft (porcine) and endogenous (primate) C-peptide levels. D and F: Blood glucose and exogenous insulin administration.

