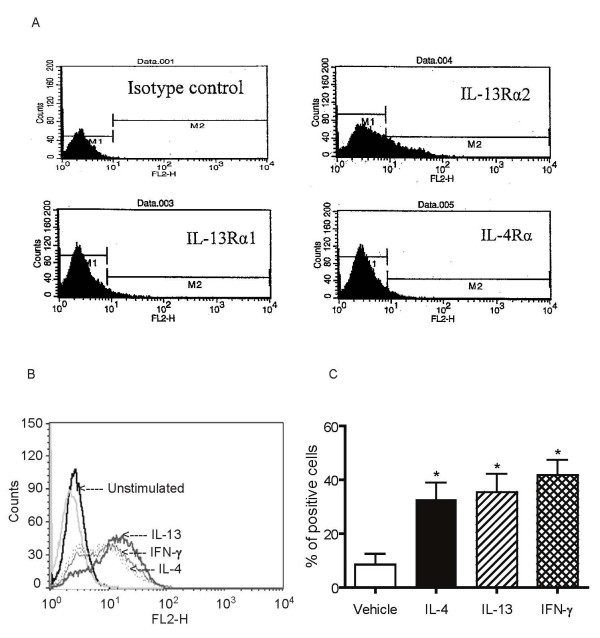
Figure 5.
Effects of IL-4, IL-13 and IFN-γ on cell surface expression of IL-13α2 receptor. A. Representative flow cytometric analysis of IL-13 receptor subunits expression in resting cells. B: Representative flow cytometric analysis of IL-13Rα2 expression in unstimulated cells and cytokine pre-treated cells. C: HASM cells were incubated with vehicle, IL-4 (5 ng/ml), IL-13 (5 ng/ml) or IFN-γ (10 ng/ml) for 24 hours. Percentage of positive cells in unstimulated cells and cells treated with IL-4, IL-13 and IFN-γ were assessed by flow cytometry and data presented as means ± SEM for 9 independent experiments * p < 0.05 compared to unstimulated cells (ANOVA).

