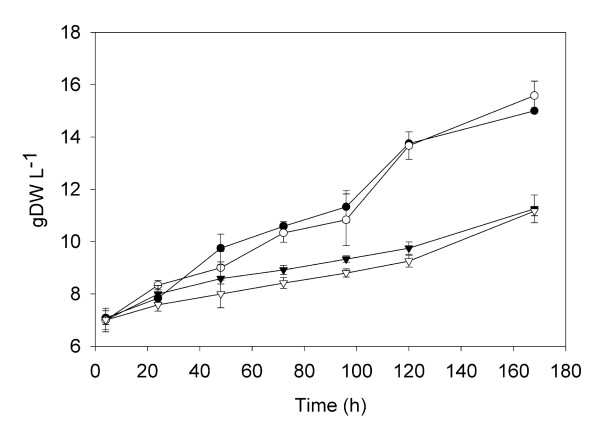
Figure 1.
Growth curves of grapevine treated cell suspension cultures. (solid circle) Control cells, (open circle) CD treated cells, (solid triangle) MeJA treated cells, (open triangle) CD+MeJA treated cells. Measurements are expressed as g DW l-1 and values are given as the mean ± standard deviation of three replicates.

