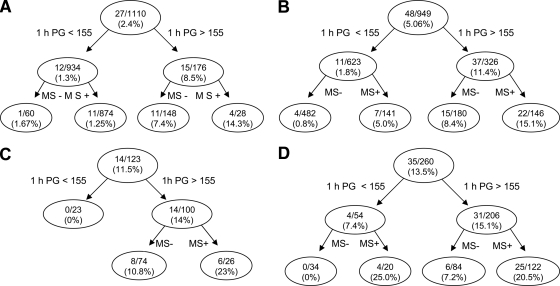
Figure 1.
Tree model based on the glucose tolerance status ([A]NGT, [B]IFG, [C]IGT, or [D]CGI [IFG + IGT]) of the subjects, 1-h plasma glucose concentration > or <155 mg/dl, and the presence or absence of the metabolic syndrome. The numbers in each nodule represent the number of subjects converting to diabetes/total number of subjects in each particular group and the incidence rate of conversion to diabetes over 8 years. 1 h PG, 1-h plasma glucose concentration during the OGTT; MS+, metabolic syndrome present; MS−, metabolic syndrome absent.

