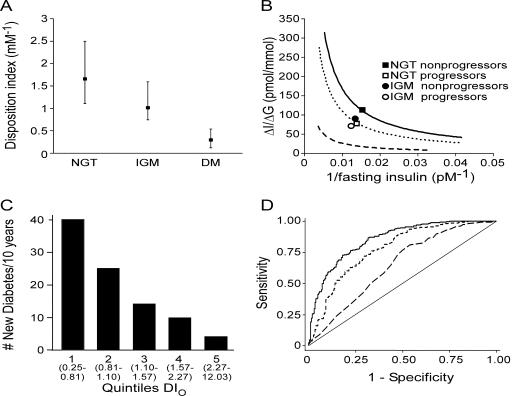
Figure 2.
A: The DIO (ΔI0–30/ΔG0–30 × 1/fasting insulin) decreases from NGT to IGM to diabetes (DM) (median [interquartile range]). B: The logarithmic means for baseline ΔI0–30/ΔG0–30 and 1/fasting insulin values are plotted for subjects with NGT (▪ and □) and IGM (• and ○) as nonprogressors (▪ and •) and progressors (□ and ○) relative to the hyperbolic curves. Progressors had lower β-cell function at baseline. C: The number of subjects who developed diabetes over the 10-year follow-up period by quintiles of baseline DIO. D: ROC curves comparing ability of baseline ΔI0–30/ΔG0–30 (dotted line), 1/fasting insulin (dashed line), and DIO (solid line) to predict cumulative diabetes at 10 years.

