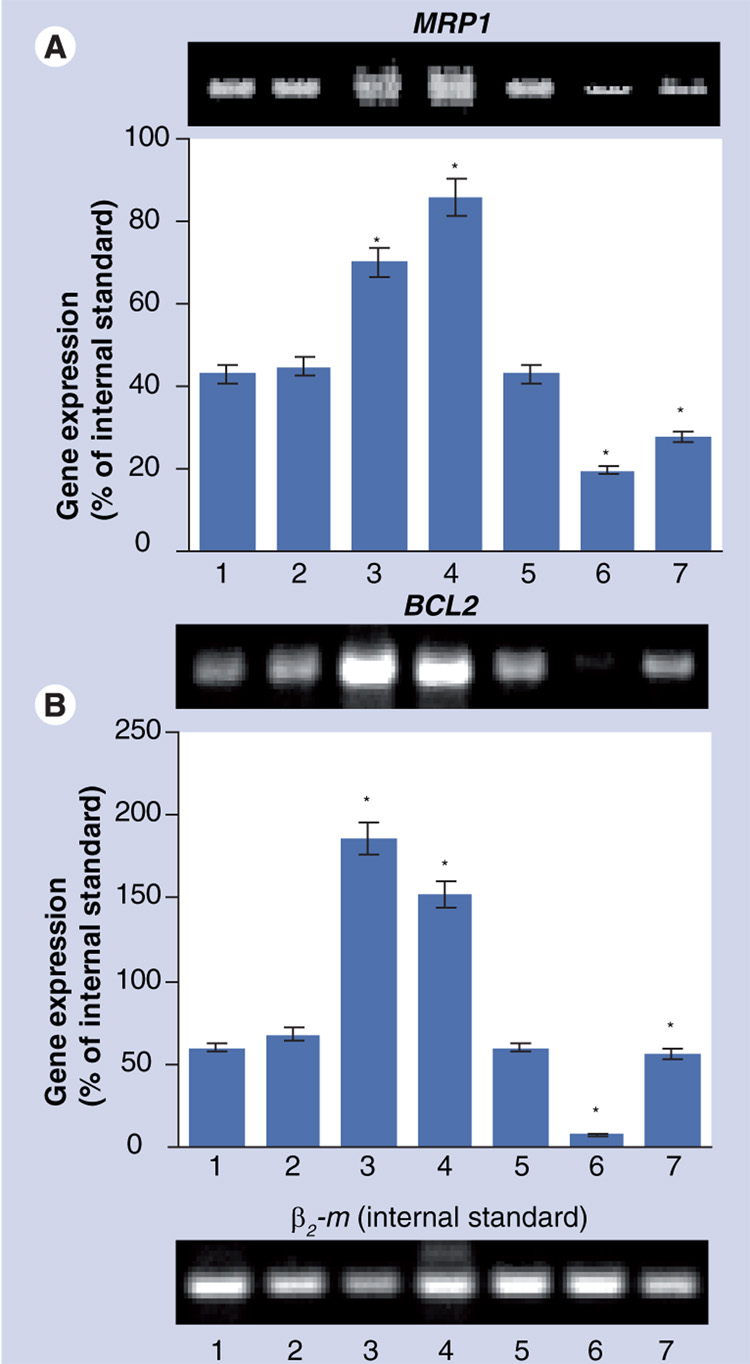
Figure 4. Typical images of gel electrophoresis of the reverse transcription-PCR products and mRNA levels for MRP1 and BCL2 in H69AR human multidrug-resistant lung cancer cells.
Cells were incubated for 48 h with the indicated formulations. β2 microglobulin (β2 m) was used as an internal standard. Means ± standard deviation are shown. (A) 1: Control (fresh media); 2: Cationic liposomes; 3: Free DOX; 4: Cationic liposomes–DOX; 5: Cationic liposomes–mock nontargeting control siRNA; 6: Cationic liposomes–MRP1 siRNA; 7: Cationic liposomes–DOX–MRP1 siRNA. (B) 1: Control (fresh media); 2: Cationic liposomes; 3: Free DOX; 4: Cationic liposomes-DOX; 5: Cationic liposomes–mock nontargeting control siRNA; 6: Cationic liposomes–BCL2 siRNA; 7: Cationic liposomes–DOX–BCL2 siRNA.
*p <0.05 when compared with control.

