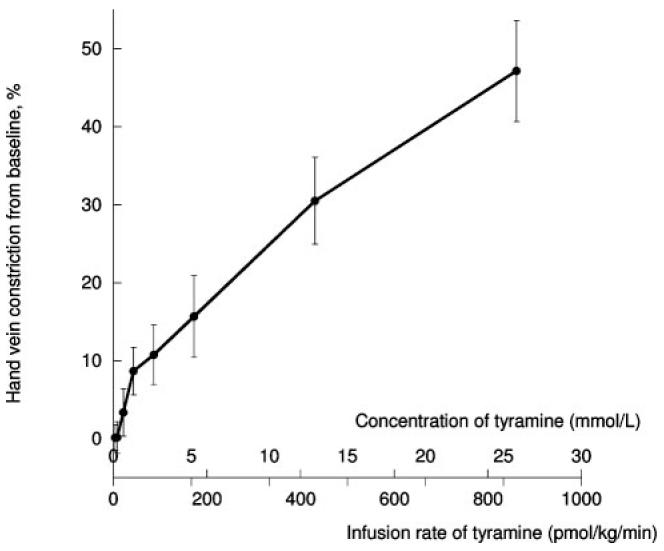
Figure 2.

Hand-vein constriction by concentration and infusion of tyramine. Error bars on y-axis illustrate the variation of percent constriction among subjects. Concentration assumes a dorsal hand-vein blood flow of 2.5 mL/min. Analysis by 2-way repeated-measures ANOVA P<0.001, with df=8 within subjects and df=1 between subjects.
