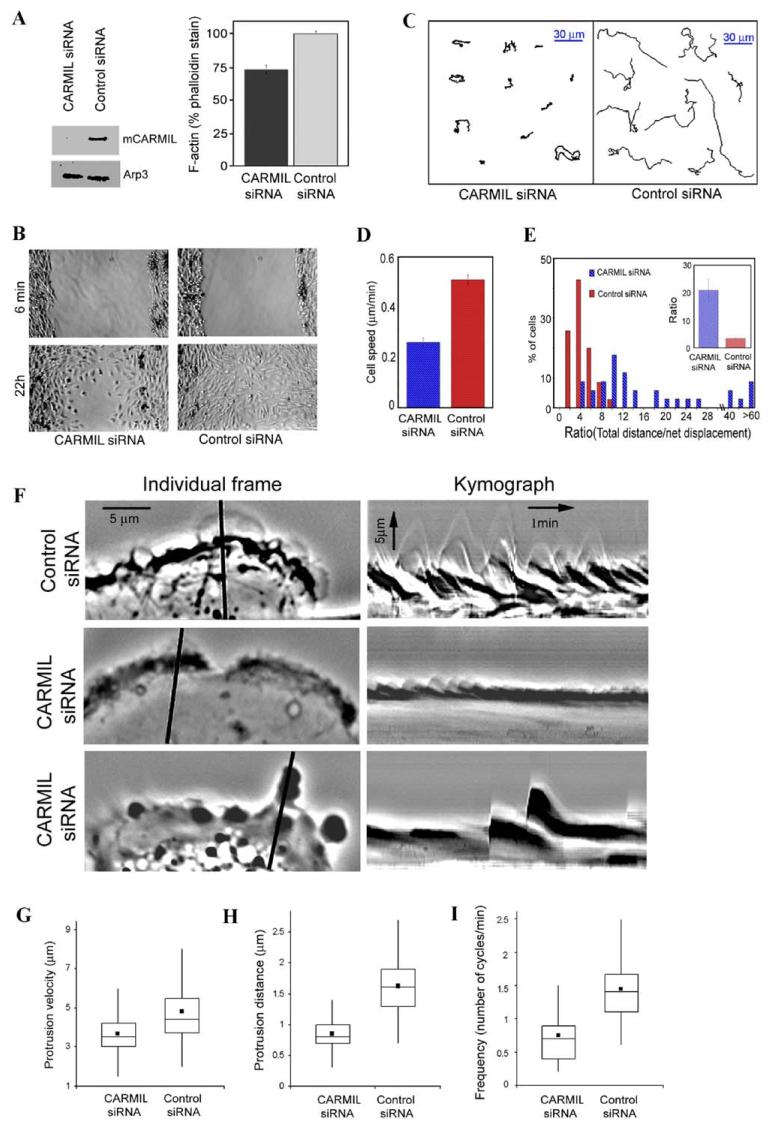
Figure 6.
Expression of mCARMIL siRNA Decreased F Actin and Cell Migration
(A) Depleting CARMIL decreases F-actin levels. Human glioblastoma cells transfected with siRNA for human CARMIL or control siRNA were cultured for 5 days. Cells were then lysed and examined for CARMIL content via a Western blot using Arp3 as a loading control (left panel). Other cells were fixed, permeabilized, stained with TRITC-phalloidin, and photographed using wide-field epifluorescence. The phalloidin staining (F-actin/cell) was quantified from the photos using ImageJ software. Data are expressed (right panel) as mean ± SEM (N for CARMIL siRNA = 79, for control siRNA = 105). Student’s t test showed the difference was significant, p < 0.001.
(B) Expression of CARMIL siRNA slowed cell migration in a wound-healing assay. A wound was scratched in confluent cultures of human glioblastoma cells transfected 4 days earlier with CARMIL siRNA or control siRNA. Shown are representative sections of the wound from CARMIL siRNA and control siRNA photographed 6 min and 22 hr after wounding.
(C–E) CARMIL siRNA slowed individual cell migration. Time lapse movies were acquired at 5 min intervals for 6 hr with 4x objective. (C) Inhibition of cell speed. Instantaneous cell speed was calculated from time lapse sequences using MetaMorph imaging software. Data are expressed as mean ± SEM, n = 34 (control siRNA) or 35 (CARMIL siRNA), p < 0.0001. (D and E) Inhibition of directional persistence. (D) Display of representative paths of cells selected on the basis of their rate being near median for the population. (E) Quantification of directional persistence. The ratio of total distance moved/net displacement was determined for each cell; this value is inversely related to the persistence in direction of movement. The percentage of cells within a range of values is shown in a histogram (higher value = the less persistence). The insert shows mean value of this ratio ± SEM, n = 34 (control siRNA) or 35 (CARMIL siRNA); p < 0.0001.
(F—I) Kymograph analysis. Individual frames and kymographs from time lapse movies of control siRNA and CARMIL siRNA cells recorded every 3 s for 10 min with a 100× objective. The line in individual frames of movies was drawn perpendicular to the tangent of the cell edge at the point of furthest protrusion; this line was used to generate kymograph using MetaMorph software.
Box and whisker plots for velocity (G), distance (how far a lamellipodium protrudes during a single protrusion/withdrawal cycle) (H), and frequency of individual protrusion events (I) from kymograph analysis. Dot shows mean; middle line of box shows median; top and bottom of box indicates 75th and 25th quartile, and whiskers indicate extent of 10th and 90th percentiles, respectively. Data for control siRNA are derived from 228 events of protrusion in 25 cells, for CARMIL siRNA, from 342 events of protrusion in 32 cells. The differences between CARMIL siRNA and control siRNA for velocity, protrusion distance, and frequency were each significant at p < 0.0001.

