
Figure 2. Activation of ESC Module in Human Cancers.
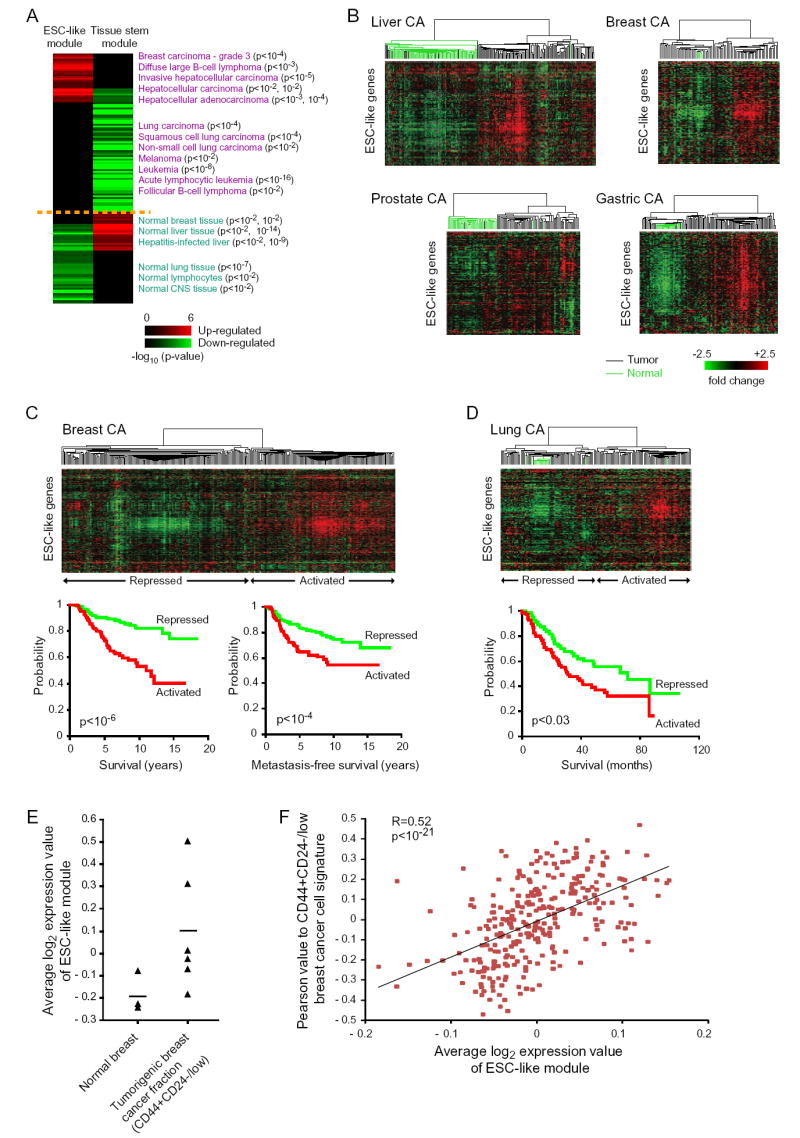
(A) Cancer gene module map: a matrix of stem cell gene modules (columns) and array clinical annotations (rows), where a red (or green) entry indicates that the arrays in which the corresponding module was significantly induced (or repressed) contained more arrays with a given annotation than would be expected by chance (FDR<0.05, p<0.01). The intensity of the entries corresponds to the significance, i.e. −log10 (p-value). A subset of significant annotations is shown; redundant annotations were removed for clarity.
(B-D) Expression patterns of ESC-like genes in primary human cancers and corresponding normal tissues are organized by hierarchical clustering. Note the coordinate regulation of the genes in the normal and cancer tissues. The dendrogram at the top of each data represent the similarities among the samples in their expression of ESC-like genes. Tumors are indicated by black branches, and normal tissues by green branches. Kaplan-Meier survival curves of tumors stratified into two classes based on expression of the ESC-like module are shown for data in (C) and (D).
(E) Average log2 expression value of all the genes in the ESC-like module in previously published expression arrays of normal breast and FACS-sorted CD44+CD24-/low tumorigenic breast cancer cells (Liu et al., 2007). A line indicating mean expression value among all samples is shown for each.
(F) Correlation of Pearson value to CD44+CD24-/low tumorigenic breast cancer cell signature with average log2 expression value of ESC-like module in the primary human breast cancers shown in (C).