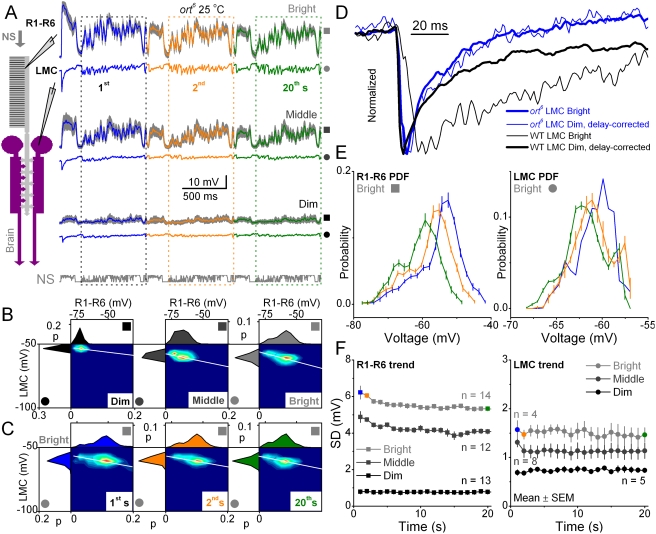
Figure 2. The ort6 R-LMC-R system show limited adaptation to naturalistic stimuli (NS).
Throughput of the feedforward pathway from R1–R6 photoreceptors to LMCs is compromised by ort6 receptors, which reduce histamine sensitivity by >10-fold [8]. A. Voltage responses of ort6 photoreceptors (mean±SD, gray, n = 7) and a representative LMC to a second long naturalistic stimulus (NS), during the first stimulus repetitions at different luminance levels at 25°C. B. The corresponding probability density functions (PDFs) for R1–R6s (top) and LMCs (left) and the joint probability density functions of the first 20 responses. In contour plots of jPDFs, hot colors denote high probability. The jPDFs quantify the input-output transformations, characterizing the synaptic gain for the given luminance of stimulation. The most probable synaptic gain, i.e. the slopes of the white lines, is quite invariable. C. The photoreceptor and LMC PDFs and jPDFs shown at the 1st, 2nd and 20th s of bright stimulation. Note that the synaptic gain (white lines) varies little over time unlike in the WT system [4]. D. The normalized responses of ort6 (blue) and WT Oregon-R LMCs (black) to dim (thin traces) and bright stimuli (thick traces). Ort6 receptors mimic extreme “light adaptation”, making the speed (time course) of the LMC output invariable at different intensities. E. High resolution PDFs of photoreceptor (left) and LMC (right) outputs shown at different times during bright stimulation. The PDFs of ort6 photoreceptors show a gradual compression in voltage range, whilst the PDFs of ort6 LMCs remain unchanged after the first second of stimulation. F. The SDs of voltage responses indicate that the adaptive trends in the photoreceptor or LMC outputs are quite similar for each luminance level. Thus, sensitivity of these cells either remains the same or reduces gradually during repetitive stimulation, unlike in WT LMCs, in which the sensitivity increases over stimulation [4]. WT LMC output has an increasing trend, similar to Fig. 1C. SDs are from the boxed data (201–1000 ms) in A.

