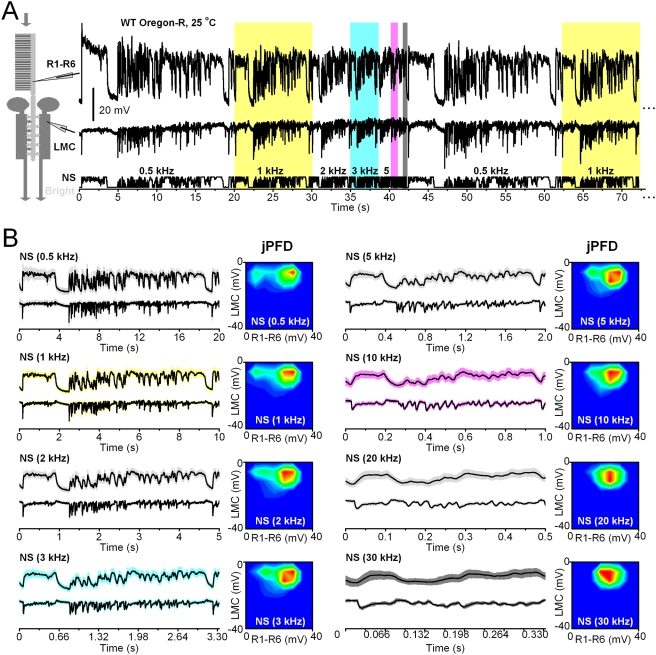
Figure 4. Adaptation to repetitive naturalistic stimulation shows scale-invariance to pattern speed.
A. The naturalistic stimulus sequence, NS, repeated at different stimulus playback velocities (bottom trace) and the corresponding intracellular voltage responses of a photoreceptor (top trace) and a LMC (middle trace). The colored sections highlight particular play-back velocities used for the stimulus during this continuous recording (yellow: 1 kHz, 10 s observation window; cyan: 3 kHz, ∼3.3 s window; magenta: 10 kHz, 1 s window; gray: 30 kHz, ∼0.3 s window). B. The time-normalized shapes of the photoreceptor (above) and LMC (below) output emphasize similar aspects of the stimulus, regardless of the used playback velocity (here from 0.5 to 30 kHz). The hot-cold color plots show the corresponding synaptic joint probabilities. Note how the size of the photoreceptor output (horizontal scale) is more reduced than that of the LMC (vertical scale), which remains relatively stable, indicating contrast constancy for all tested playback velocities of stimulation. The changes in the speed of the naturalistic stimulus (attributable to the time-scale invariance of 1/f statistics) [24] maintain the power falling within the frequency range of LMC output relatively similar. LMCs can, thus, integrate voltage responses of a similar size for the same stimulus pattern, much irrespective of its speed. Mean±SD shown, n = 7 repetitions.

