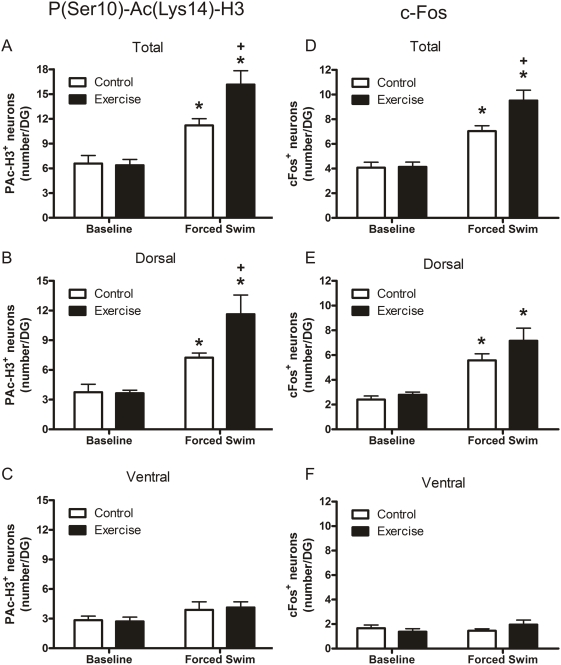
Figure 4. Effect of forced swimming on the number of P(Ser10)-Ac(Lys14)+ (Left panels A, B, and C) and c-Fos+ neurons (right panels D, E and F) in the dentate gyrus of control, sedentary and 4-weeks exercised rats.
A and D show data on total number of immuno-positive neurons in the dentate gyrus whereas in B and E and in C and F data are depicted separately for the dorsal blade and the ventral blade, respectively. Data are expressed as the number of immuno-positive neurons (mean±SEM, n = 6) in the dentate gyrus of a 10-µm section. For additional information, see Materials and Methods. Statistical analyses: Two-way ANOVA: A, Effect of exercise: F(1,24) = 3.495, P = 0.077, Effect of forced swimming: F(1,24) = 32.292, P<0.0005, Interaction exercise x forced swimming: F(1,24) = 4.135, P = 0.056; B, Effect of exercise: F(1,24) = 21.144, P<0.0005, Interaction exercise x forced swimming: F(1,24) = 3.257, P = 0.087; D, Effect of exercise: F(1,24) = 5.598, P = 0.026, Effect of forced swimming: F(1,24) = 59.533, P<0.0005, Interaction exercise x forced swimming: F(1,24) = 4.993, P = 0.035; E, Effect of forced swimming: F(1,24) = 38.318, P<0.0005. *, P<0.05, compared to the respective Baseline group; +, P<0.05, compared to the respective Control group, post-hoc Bonferroni test.

