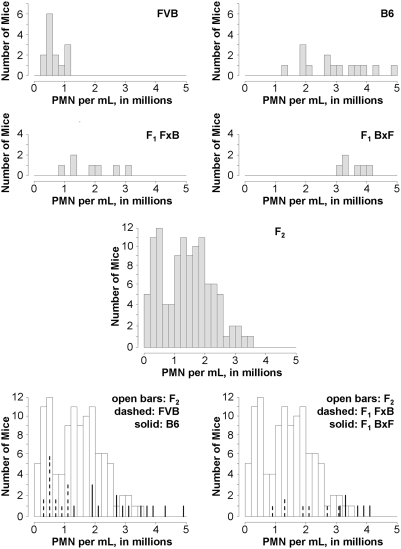
Figure 2. Histograms showing distributions of individuals within three generations of PECAM-deficient mice.
The histograms each show the number of mice having inflammation scores within a given range (cell increment 2×10⁵ PMN per mL). Overlays allow for visualization of the degree of overlap between the respective populations.

