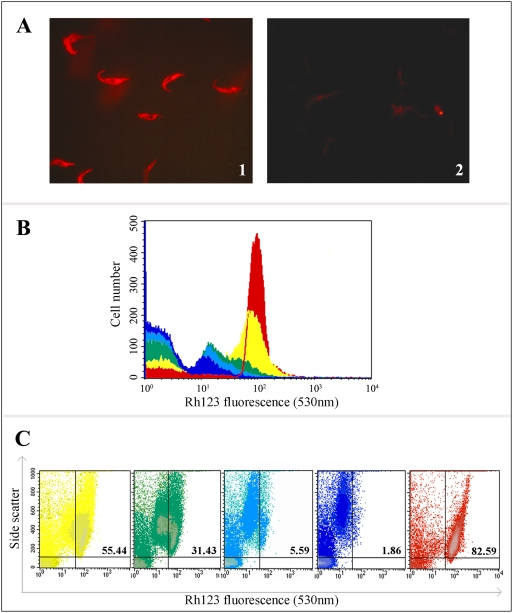
Figure 5. Analysis of trypanosomal mitochondrial activity by fluorescence microscopy and flow cytometry before and after treatment with BMAP-18.
T. b. brucei 427.01 PCF were incubated with rhodamine123 as described in the Materials and Methods, examined by fluorescence microscopy and digitally photographed (Panel A1). The rhodamine 123 labeled trypanosomes were then treated with a low dose of BMAP-18 (5 µg/mL) and photographed again (Panel A2). Rhodamine fluorescence (FL-2) was also monitored by flow cytometry, before and after varying intervals of BMAP-18 treatment (Panel B). The different colours indicate different incubation times with the BMAP-18 peptide. Red: diluent control, 30 min; Yellow: BMAP-18 treated, 5 min; Green: BMAP-18 treated, 10 min; Light blue: BMAP-18 treated, 20 min; Dark blue: BMAP-18 treated, 30 min. The plot clearly shows decreasing rhodamine 123 fluorescence as the incubation period of BMAP-18 with the trypanosomes was extended from 0–30 minutes. A dot-plot comparison of this experiment (Panel C) showed the effects of BMAP-18 treatment on fluorescence intensity vs side scatter (cell granularity) over time. The numbers in the upper right quadrants of the dot-plots indicate the percentage of healthy cells with strong mitochondrial rhodamine fluorescence. In Panel B, the horizontal (X) axis indicates arbitrary fluorescence units and the vertical (Y) axis indicates the number of cells (events). In Panel C, the Y axis is SSC (side scatter).

