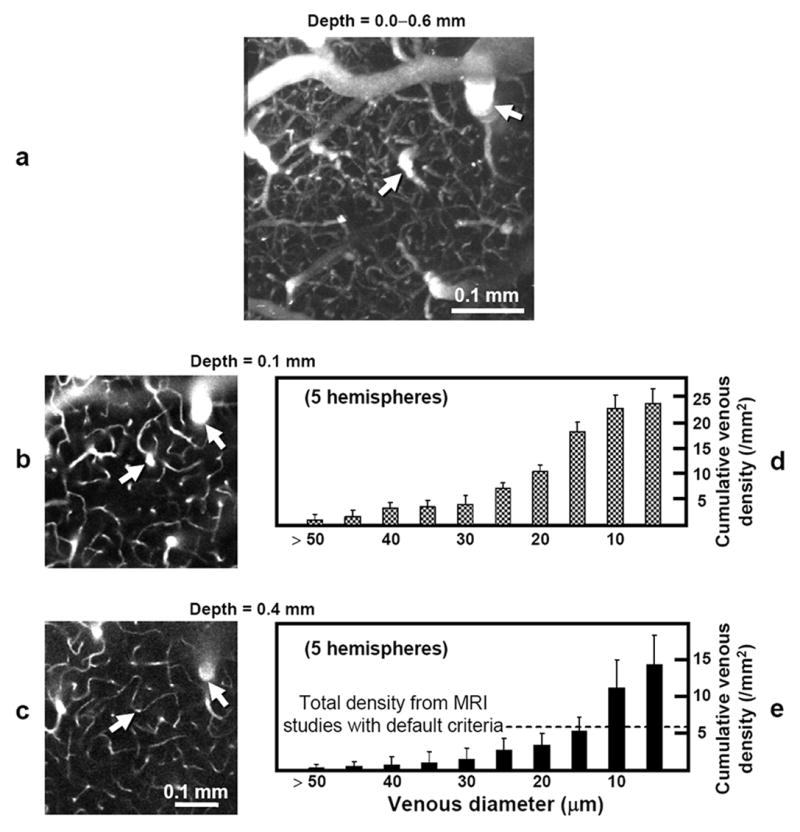
FIG. 5.

Images from a 3D in vivo two-photon angiographic dataset and cortical depth-dependent quantification of venous distributions. a–c: Data from one animal. The ability of this in vivo technique to resolve intracortical arteries and veins with much finer detail than by BOLD venography is illustrated in the maximum-intensity projected reconstruction (0.456 × 0.456 × 0.6 mm3) along the axial direction (a), where complete vascular networks including capillaries with ~5-μm diameter are observed. Two-dimensional single plane images (0.456 × 0.456 mm2) parallel to the surface at cortical depths of 0.1 mm (b) and 0.4 mm (c) show that relatively large sized vessels perpendicular to the cortical surface appeared as round shapes. Intracortical veins (and also arteries) can be traced between the surface and deep cortical regions, as seen in examples indicated by arrows. Note that these two-photon microscopy images (b and c) represent only ~1/16 the area as compared to the MRI venograms of Fig. 4c–f. Cumulative intracortical venous densities (expressed as minimum venous diameter) are plotted as a function of diameter at cortical depths of 0.1 (d) and 0.4 mm (e) for all studies (N = 5). The right-most bar in each plot represents total venous density, which decreases with cortical depth (p < 0.05). Vertical scales were independently adjusted for better visualization. The density of smaller-diameter venous vessels (10–30 μm) is higher than that of larger-diameter vessels at both cortical depths. Density at 0.4-mm depth for intracortical venous vessels with diameter ≥ 15 μm is 5.3 ± 1.8/ mm2, which roughly corresponds to the venous density measurement of 5.7 ± 1.0 / mm2 from our MRI data at the same depth using the default criteria (broken line). Note that due to a small field of view of two-photon microscopy, the two-photon densities were quantified for regions covering roughly half the area as compared to MRI data.
