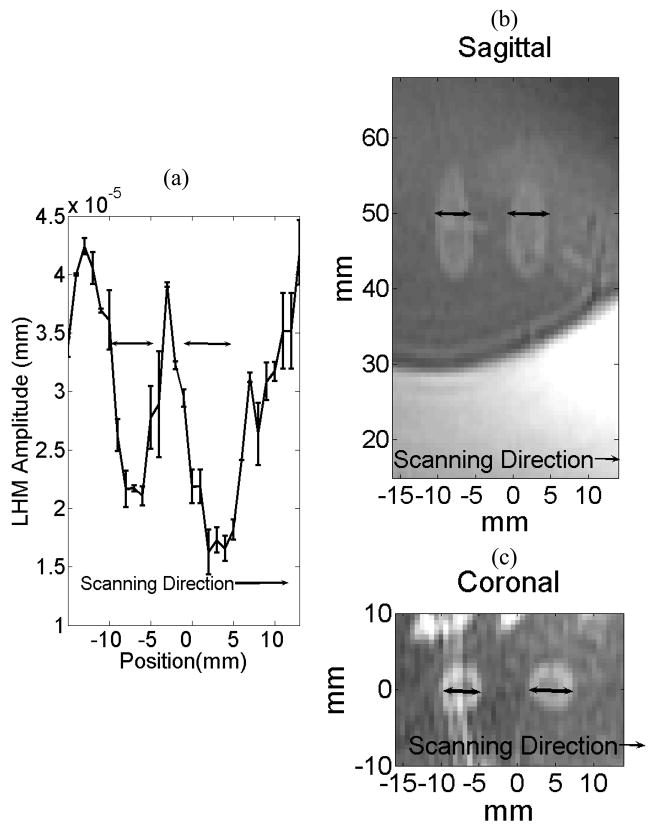
Figure 10.
Spatial LHM scan after two sonications (at locations Nos. 13 and 14) and the corresponding sagittal and coronal T2-weigthed MR images. The focus of the FUS transducer was located at the same vertical position for both sonications (at 50 mm in the sagittal image). The sonications were made 10-mm apart following the scan direction (superior/inferior). (a) Value of the LHM amplitude following the scanning direction. Corresponding T2-weighted sagittal (b) and coronal (c) MR images of the lesions.

