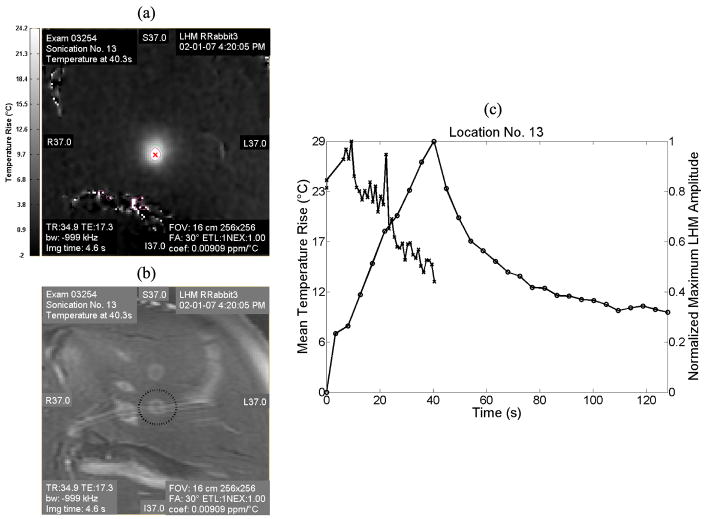
Figure 6.
Temperature and LHM amplitude during the sonication for the location No. 13. (a) MRI temperature map (coronal) at the end of the sonication (43.8 s) and (b) corresponding T2-MR image after the sonication. (c) Plot of the temperature rise at the focus (left axis, round markers with continuous line) and of the normalized LHM amplitude (right axis, cross markers with dashed line) as a function of time for the same location.

