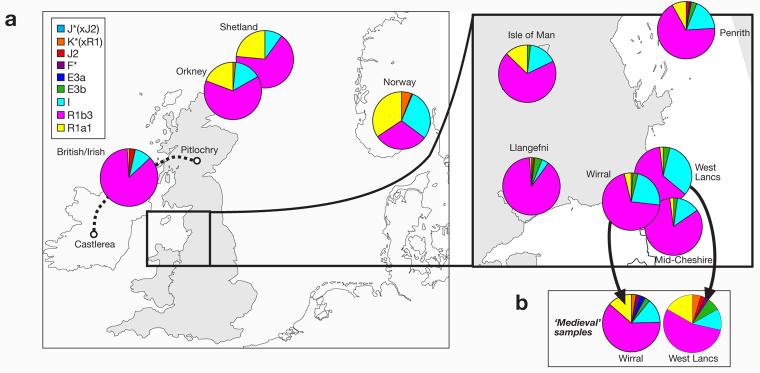
Figure 3. Haplogroup distributions in Wirral, West Lancashire and control populations.
a) Haplogroup profiles of ‘modern’ samples from the Wirral and West Lancashire, and from control populations. Sectors in pie charts are colored according to haplogroup, and sector areas are proportional to haplogroup frequency. Lancs: Lancashire.
b) Haplogroup profiles of ‘medieval’ samples from the Wirral and West Lancashire, ascertained by surname.

