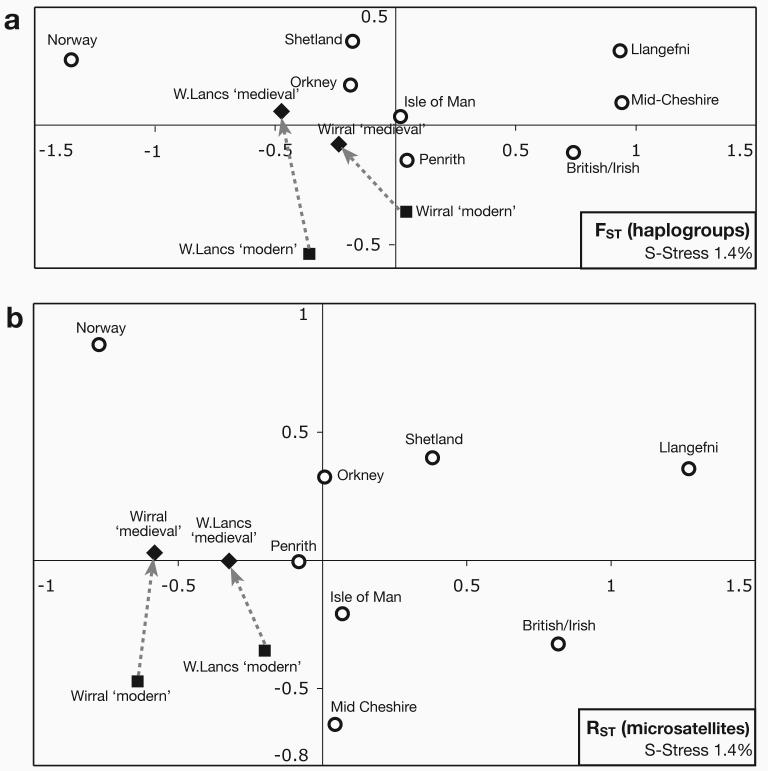
Figure 4. Multidimensional scaling (MDS) plots illustrating the relationships between Wirral, West Lancashire and control populations.
a) MDS based on population pairwise FST values from haplogroup data. Dotted arrows highlight the differences between ‘modern’ and ‘medieval’ Wirral and West Lancashire samples. Lancs: Lancashire.
b) MDS based on population pairwise RST values from microsatellite data.

