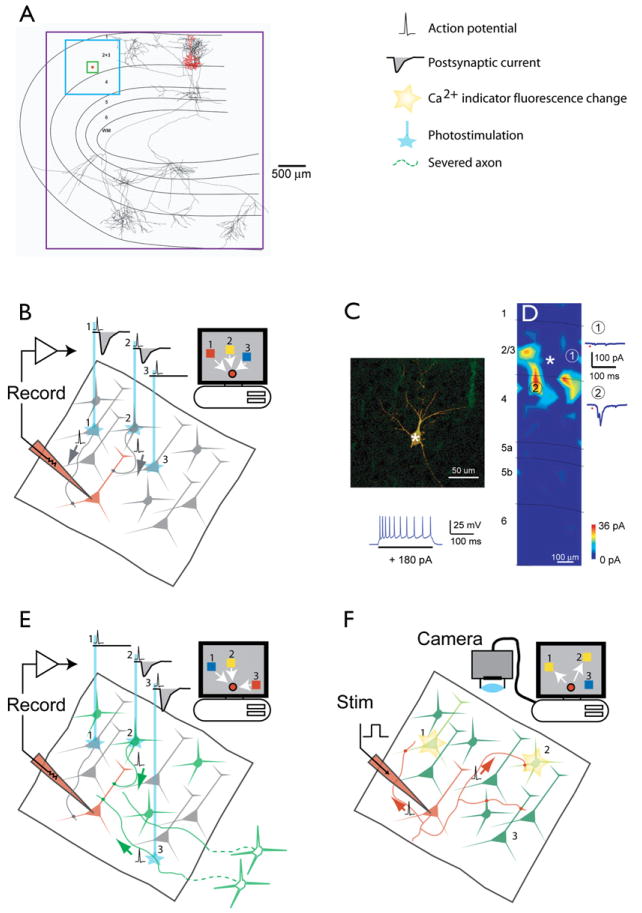
Figure 5. Methods for Functional Circuit Mapping in Brain Slices.
(A) The spatial ranges of circuit mapping techniques. The boxes indicate the lengthscales accessible to different methods. Red box, 20 μm, 3D electron microscopy reconstructions; green box, 200 μm, paired recordings; blue box, 1000 μm, laser scanning photostimulation with glutamate uncaging and optical probing; purple box, potentially the entire brain, axon tracing and ChR2-assisted circuit mapping. The reconstruction is a layer 2/3 pyramidal neuron superposed on a schematic of the cat visual cortex (J. Hirsh, USC). Dendrites are in red; axons, in black.
(B) Glutamate uncaging mapping. The schematic shows a brain slice in which synaptic responses are recorded in a single neuron (red). Neurons are excited by photolysis of caged glutamate, typically by using a UV laser that is scanned over the brain slice (blue line). If glutamate is photoreleased near the soma (but not on distal dendrites or axons), it evokes action potentials. Postsynaptic whole-cell currents (or potentials) recorded in the recorded neuron are used to generate a map in a computer. This so-called “synaptic input map” is a quantitative representation of the spatial distribution of synaptic input to the recorded neuron.
(C and D) The use of glutamate uncaging mapping to measure the spatial distribution of excitatory inputs impinging onto genetically defined GABAergic interneurons (X. Xu and E.C., unpublished data). (C) Morphology of the recorded neuron in neocortical layer 2/3. GFP fluorescence is overlaid with Cy3 streptavidin labeling intracellularly injected biocytin (top). (Bottom) Firing pattern of the recorded neuron. (D) Synaptic input map showing hotspots of input from layer 4 and layer 2/3. Traces to the right are examples of excitatory postsynaptic currents evoked following stimulation at sites 1 and 2.
(E) ChR2-assisted circuit mapping. A specific subpopulation of neurons is targeted for expression of ChR2 (green). ChR2-positive neurons (2) and axons (3) are excited by a blue laser that is scanned over the brain slice (blue lines), whereas ChR2-negative neurons are not perturbed (1). Postsynaptic whole-cell currents (or potentials) are used to generate a map in a computer. ChR2-assisted circuit mapping has genetic specificity because ChR2 expression is necessary for exciting action potentials. Furthermore, since severed axons can be excited (3), connectivity between distal brain regions can be studied even in a brain slice.
(F) Optical probing. All neurons are bulk-loaded with Ca2+ indicator. One neuron is stimulated with brief bursts of action potentials. Postsynaptic neurons that fire action potentials can be detected using [Ca2+] imaging.

