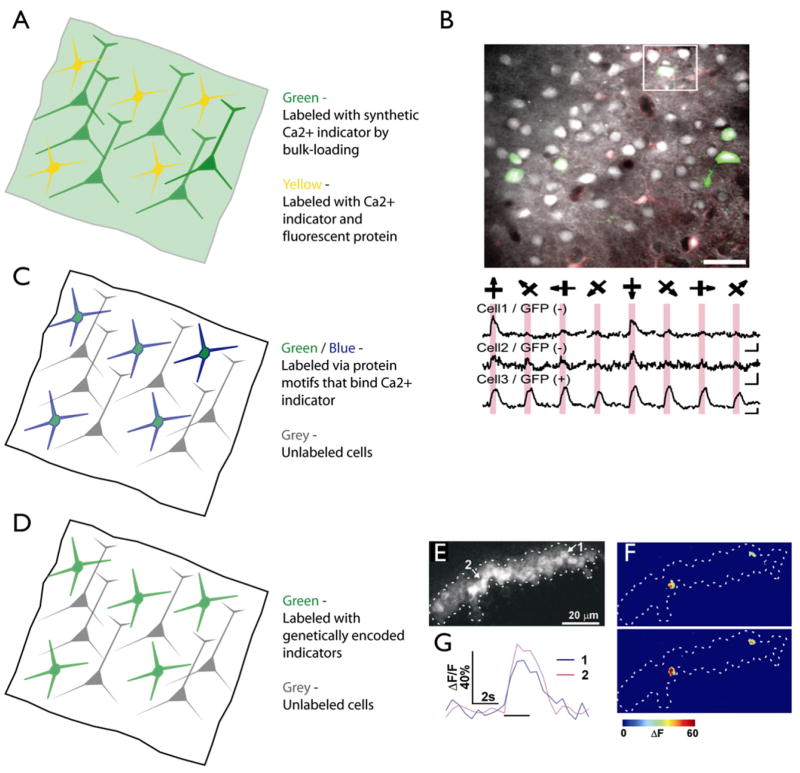
Figure 6. Strategies for Imaging Genetically Specified Neuronal Populations with [Ca2+] Indicators.
(A) All neurons are labeled nondiscriminately by bulk-loading with a [Ca2+] indicator (diffuse green). A genetically specified set of neurons express a fluorescent protein (yellow).
(B) [Ca2+] imaging in mice expressing GFP in GABAergic interneurons. (Top) Image showing neurons bulk-loaded with [Ca2+] indicator. GFP fluorescence is overlaid in green. (Bottom) Responses of GFP-negative and GFP-positive (GABAergic) neurons to oriented bars. Modifed from Sohya et al., 2007.
(C) A genetically specified subpopulation of neurons express a protein (such as tetracysteine motifs; blue) that makes them susceptible to labeling by modified versions of [Ca2+] indicators (such as biarsenicals; green).
(D) A genetically specified subpopulation of neurons express a genetically encoded [Ca2+] indicator (green).
(E–G) Imaging odor-evoked activity in Kenyon cells of the Drosophila mushroom body using genetically encoded [Ca2+] indicators (G-CaMP1.3) in vivo. (E) G-CaMP fluorescence showing the mushroom body. (F) Two responses to the same odor (difference image; 2 s after odor onset minus baseline). Two Kenyon cells show strong activity. (G) Time course of G-CaMP responses. Modified from Wang et al., 2004.

