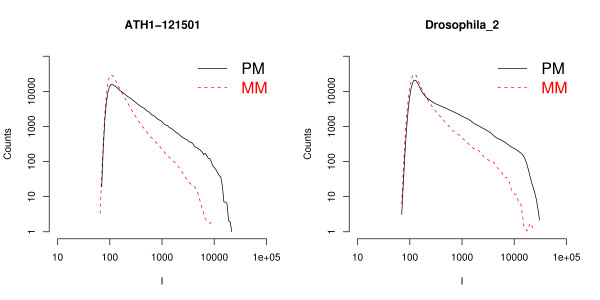
Figure 1.
PM and MM intensity histograms. Histograms of the intensities of PM and MM for two experiments on Arabidopsis thaliana and Drosophila melanogaster. These histograms show very similar features: a common behavior at low intensities followed by a split of the PM and MM histograms at higher intensities.

