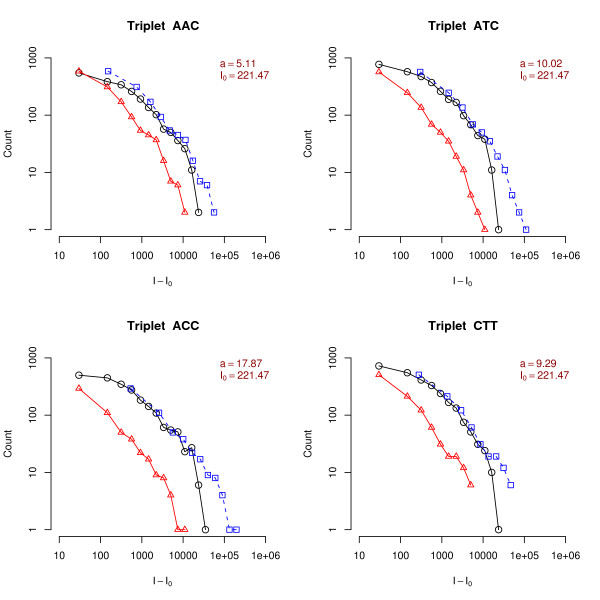
Figure 2.
Rescaling of central triplet histograms. Histograms of the background subtracted intensities of PM (circles) and MM (triangles) for a D. melanogaster chip. The probes are now grouped according to their central triplet; only 8 out of 64 cases are shown. The dashed lines (squares) are obtained by multiplying the MM histogram by a factor aα, which results in a horizontal shift of the background corrected intensity histogram when plotted in log-log scale. The overlap between the PM and rescaled MM histograms is a proof of the validity of Eq. (6). We recall that the central triplet sequence is that of the PM probe, hence, say, a ACC triplet corresponds to a mismatch of GG type.

