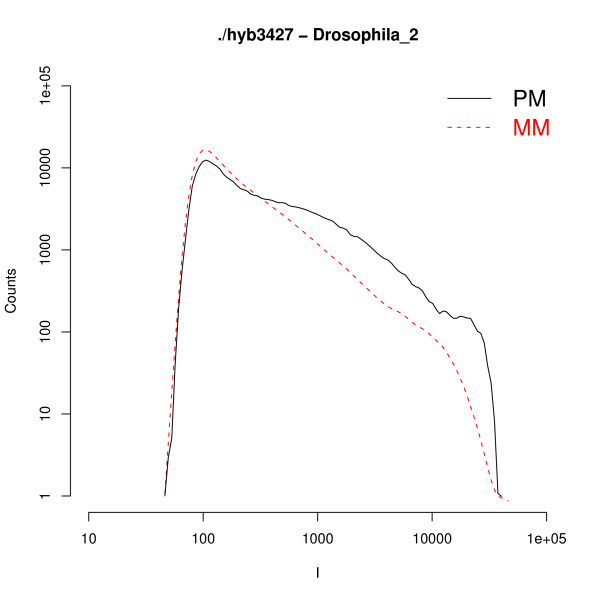
Figure 5.
PM and MM histograms for a D. Melanogaster chip. PM and MM histograms of a D. melanogaster experiment with a big stain on it. The plot already shows that both histograms are unusually close to each other. This anomalous behavior yields unavoidably low PM/MM background subtracted ratios: e.g. in this case the analysis gives a global a = 2.87, instead of the typical a ≃ 5 found in the Drosophila chips.

