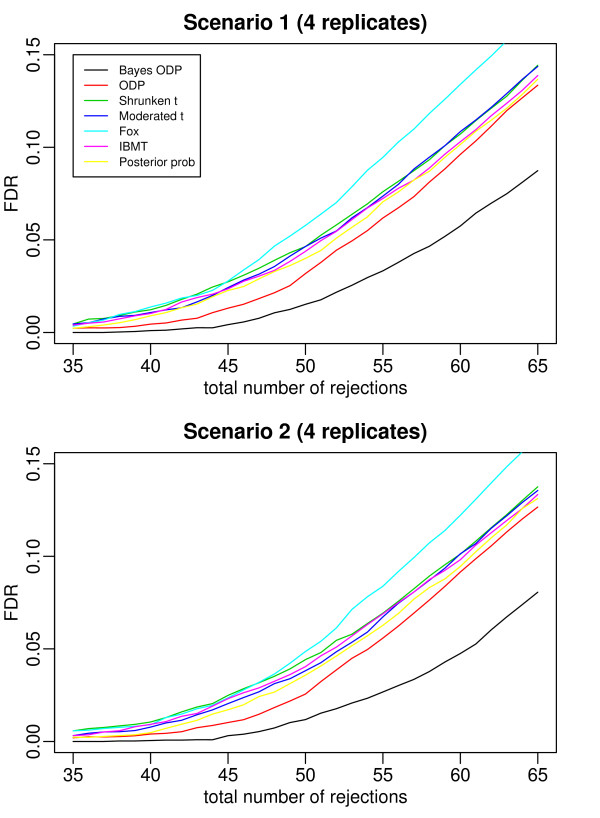
Figure 4.
ROC curves which compare the Bayesian ODP, the original ODP, the posterior probability from the Bayesian model, the shrunken t, the moderated t, Fox, and IBMT. The number of replicates per gene is 4. In Scenario 1, gene variances are gene-specific; in Scenario 2, 80% of gene variances are gene-specific and 20% of genes have a common variance.

