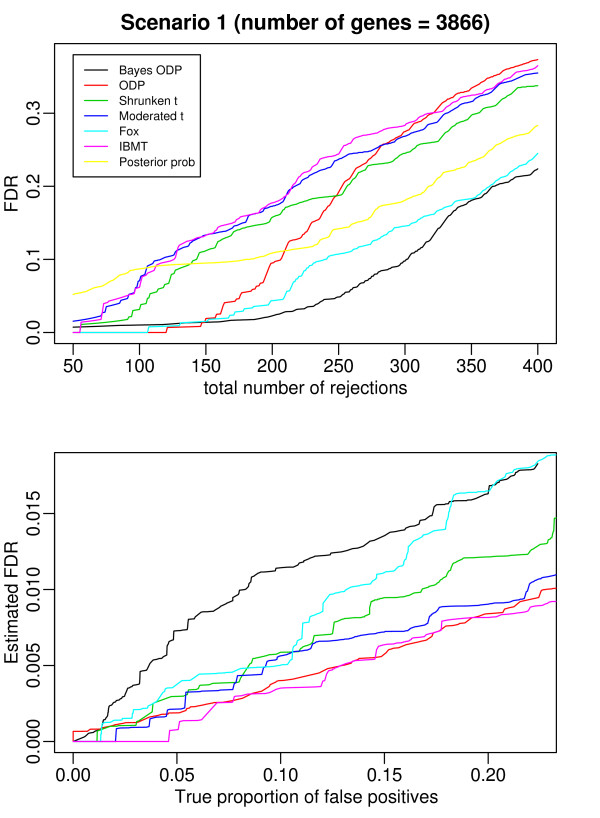
Figure 7.
Results from the comparison based on the Golden Spike dataset under Scenario 1 where the total number of genes to compare is 3866. The top figure plots the FDR versus the total number of rejected genes. The bottom figure plots the estimated FDR versus the true proportion of false positives.

