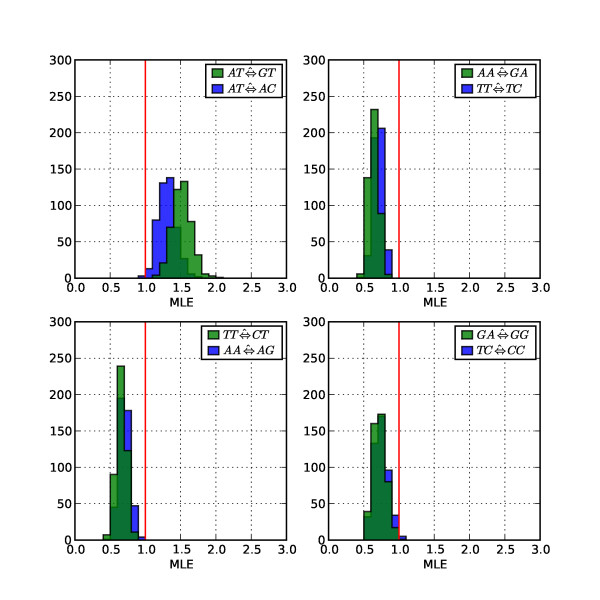
Figure 5.
Distribution of MLEs for non-CpG top 10 ranked dinucleotide parameters under NF. x-axis – MLEs, these were the same as those used to calculate the means in Figure 3; y-axis – the number of alignments. The vertical red line corresponds to the expected value under the null hypothesis (the parameter has no effect). Strand complementary substitutions are plotted on the same chart.

