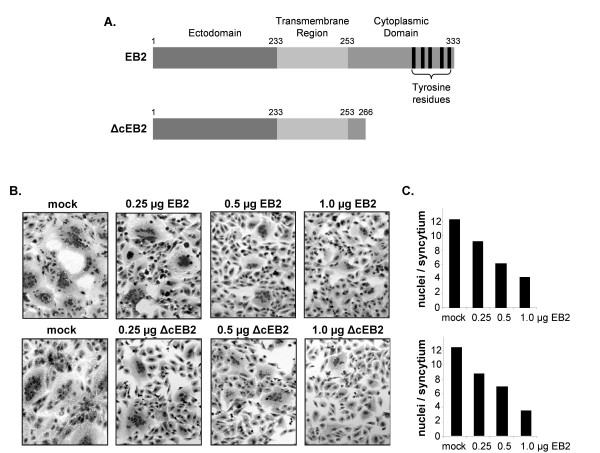
Figure 5.
Influence of EB2 and ΔcEB2 overexpression on NiV glycoprotein-mediated cell-to-cell fusion. (A) Schematic diagram of EB2 and ΔcEB2. Numbers indicate the amino acid positions. (B) Vero cells were cotransfected with constant amounts of NiV glycoprotein DNA and the indicated quantities of plasmids encoding either EB2 or ΔcEB2 protein. After 24 h, cells were fixed and stained with Giemsa solution. (C) Quantification of syncytium formation was performed as described in the legend to Fig. 1D.

