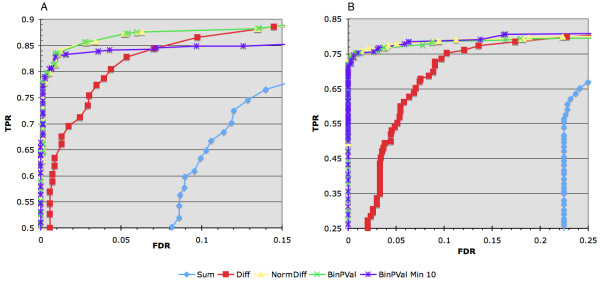
Figure 3.
Performance of different window summary statistics. A comparison of the TPR against the FDR for four different window summary statistics associated with the low (A) and high (B) spike-in datasets. Each of the window scanning statistics (Sum: sum of the chIP reads within the window, no input; Diff: difference between the number of chIP reads and input reads; NormDiff: normalized difference, the difference divided by the square root of the sum; BinPVal: binomial p-value; BinPVal Min 10: binomial p-value using a prefiltered dataset where only windows with 10 or more total reads from the chIP and input datasets were used to score the mapped spike-in data. Multiple sets of enriched regions where generated over a range of thresholds. Each set was then intersected with the appropriate spike-in key and the TPR and FDR plotted.

